 Fundamentals Hub
You open a company page, see revenue up, EPS positive, and the chart near a high. That is not analysis yet. A stock can look strong on the surface while margins are weakening, cash flow is lagging, or debt is doing more work than the operating business.
This checklist shows how to analyze stock fundamentals from the financial statements outward. It is written for investors and builders who want a repeatable workflow, not a stock recommendation. It will not tell you whether to buy a specific stock. It will show how to examine revenue quality, profitability, cash generation, balance sheet risk, and peer context using standardized data.
For a broader primer, the fundamental analysis guide explains the full discipline. This post is narrower: a practical checklist you can reuse company by company.
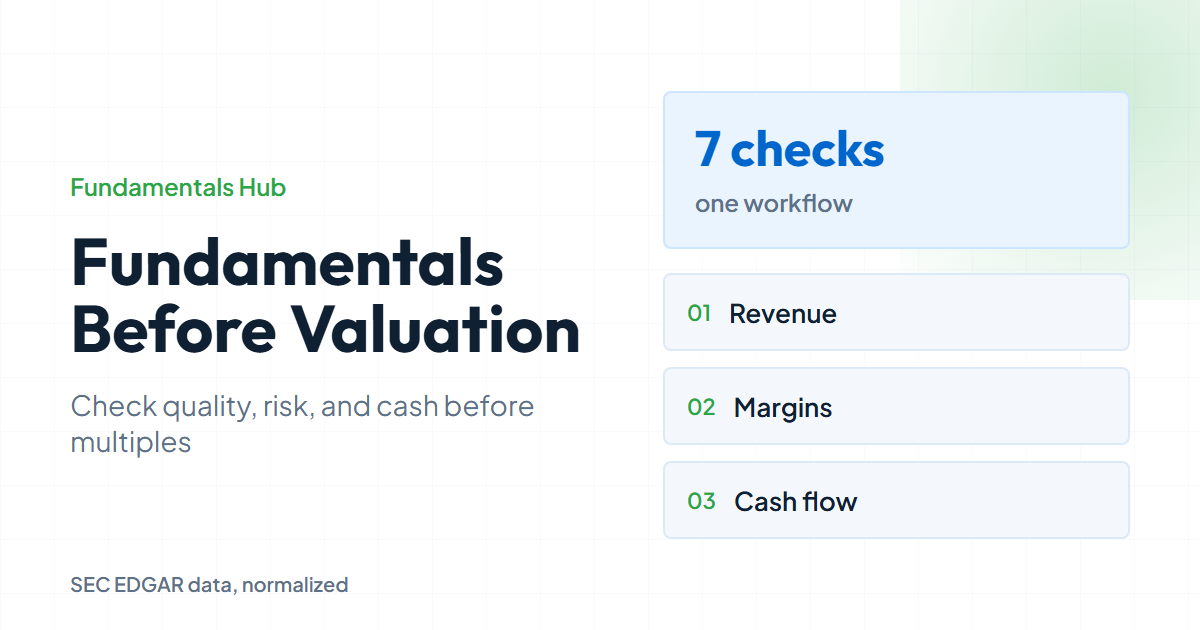
How to Analyze Stock Fundamentals in Seven Checks
- stock fundamentals
- Stock fundamentals are the business and financial statement signals used to evaluate company quality and risk.
- revenue quality
- Revenue quality asks whether sales growth is durable, profitable, and supported by the underlying business.
- free cash flow conversion
- Free cash flow conversion compares free cash flow with net income to test whether earnings become cash.
- balance sheet risk
- Balance sheet risk is the financial pressure created by debt, liabilities, liquidity needs, and limited cash cushion.
A useful stock fundamentals workflow has an order:
- Define the question.
- Check revenue quality.
- Read margin structure.
- Compare earnings with cash flow.
- Review balance sheet risk.
- Compare against relevant peers.
- Document what would change your view.
That order matters. Valuation multiples are tempting because they are easy to rank. But a low multiple does not mean much until you know whether the business quality, cash conversion, and balance sheet justify the discount.
Use the same period basis for each check. TTM is good for current operating performance. Annual history is better for durability. Quarterly data is useful for recent inflections. Mixing those views without labeling them is how a checklist turns into noise.
1. Define the Question Before Reading Ratios
Before pulling numbers, write the question the analysis needs to answer.
Examples:
- Is this company growing with stable or improving margins?
- Is accounting profit turning into cash?
- Is the balance sheet strong enough to handle a downturn?
- Does the company look stronger or weaker than close peers?
- Is recent performance a one-period event or a pattern?
The question controls the metrics. If the question is balance sheet risk, debt, liquidity, liabilities, and cash flow coverage matter more than revenue growth. If the question is operating quality, gross margin, operating margin, and free cash flow conversion move higher in the workflow.
This discipline also helps avoid confirmation bias. Without a question, it is easy to collect only the numbers that support the view you already wanted.
2. Check Revenue Quality
Revenue growth is the first signal, but it is not enough. The quality of that revenue matters.
Look for:
- Consistency across annual periods.
- Recent TTM direction versus the last fiscal year.
- Gross margin stability.
- Segment or product mix changes, when disclosed.
- Filing-level receivables or contract balances growing faster than sales, when those details are available.
For a first pass, calculate:
revenue_growth = (revenue_current - revenue_prior) / revenue_prior
gross_margin = gross_profit / revenue
If revenue rises while gross margin falls, ask why. The company may be discounting, shifting product mix, absorbing input cost pressure, or investing in a lower-margin growth area. The answer can be acceptable, but it should be explicit.
3. Read Margins Down the Statement
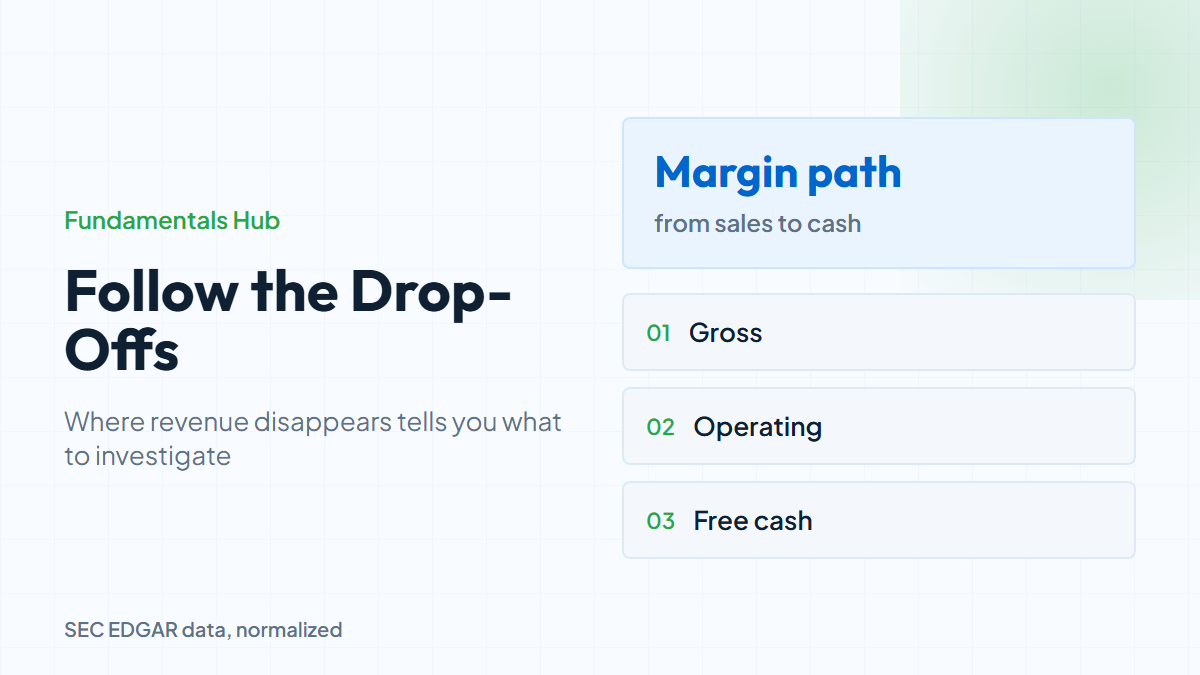
Margins show where the business creates or loses economic strength. Gross margin starts with product economics. Operating margin includes the cost of running the company. Net margin includes taxes, interest, and non-operating items.
Use this sequence:
gross_margin = gross_profit / revenue
operating_margin = operating_income / revenue
net_margin = net_income / revenue
Stable gross margin with falling operating margin points toward operating expenses. Falling gross margin with stable operating margin can mean cost cuts are hiding product-level pressure. Rising net margin with flat operating margin can come from tax, interest, or one-time items.
For stock fundamentals, the pattern matters more than a single period. A company with lower margins but steady improvement can be more interesting than one with high margins that are rolling over.
4. Compare Earnings With Cash Flow
Earnings are accounting profit. Cash flow shows how much cash the business produces after operating needs and investment.
Start with:
free_cash_flow = cfo - abs(capex)
fcf_margin = free_cash_flow / revenue
fcf_conversion = free_cash_flow / net_income
Using abs(capex) makes the formula work whether the source stores capital expenditures as a positive cash spend or a negative cash flow. Keep that convention consistent before comparing free cash flow margins across companies.
When net income is positive, free cash flow conversion above 1.0 means free cash flow is higher than net income for the period. That can happen for good reasons, such as deferred revenue or non-cash expenses. Conversion below 1.0 is not automatically bad, but it deserves a reason.
The key is direction. If net income improves and free cash flow weakens for several periods, the fundamentals are less clean than the income statement suggests. If free cash flow is consistently stronger than net income, understand why before assuming the stock is cheap. Free cash flow conversion is also less useful when net income is negative or close to zero, because the denominator can distort the signal.
For more detail on this metric, read Free Cash Flow Explained. In this checklist, use cash flow as a quality check on reported profit.
(Fundamentals Hub calculates standardized free cash flow from CFO and capex, so the checklist can use one field instead of rebuilding the cash flow statement for every company.)
5. Review Balance Sheet Risk
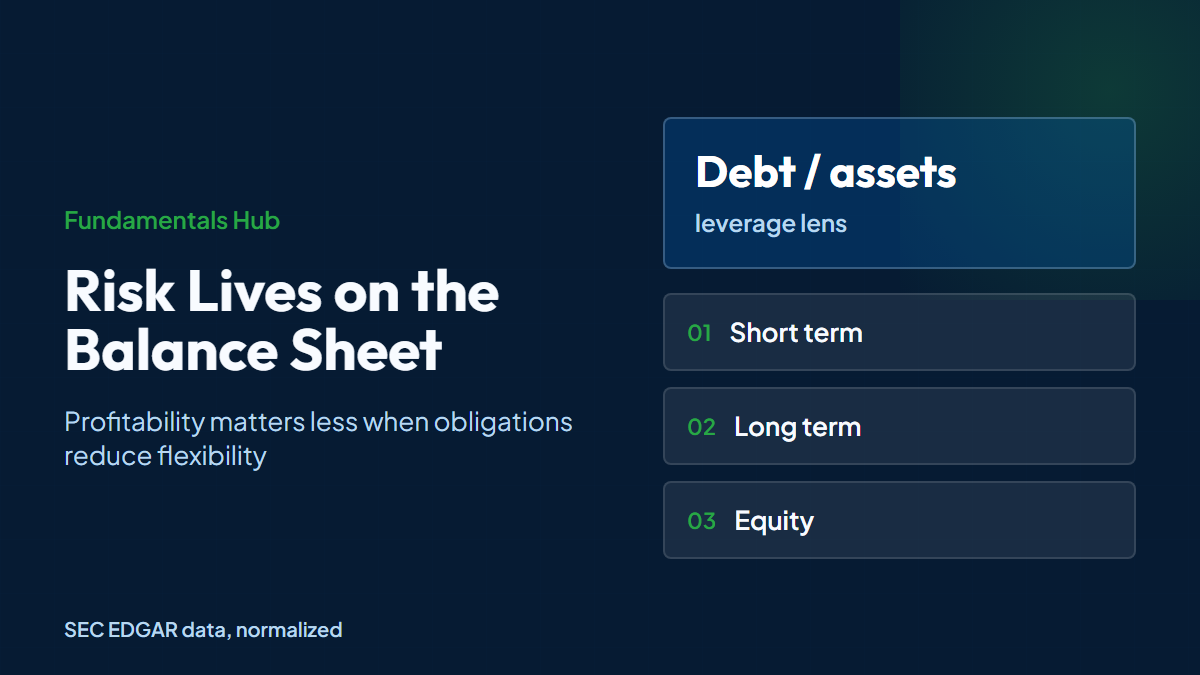
The balance sheet tells you how much flexibility the company has. Strong profitability matters less if the company has little cash cushion, heavy near-term obligations, or debt that reduces room for error.
Check these fields:
- Cash and equivalents
- Current assets
- Current liabilities
- Short-term debt
- Long-term debt
- Total liabilities
- Total assets
- Total equity
Then calculate a few simple ratios:
current_ratio = current_assets / current_liabilities
debt_to_assets = total_debt / total_assets
liabilities_to_assets = total_liabilities / total_assets
Debt to equity is useful when equity is positive and meaningful. It becomes harder to read when equity is very small or distorted by buybacks. In those cases, debt to assets and liabilities to assets can be more stable.
6. Compare Against Peers
A company does not operate in a vacuum. Margins, capital intensity, and leverage norms differ across industries. Peer comparison turns a number from "high" or "low" into "high or low for this type of business."
Choose peers based on business model, not popularity. A retailer, software company, payment network, and manufacturer should not be ranked in the same table unless the question is broad market screening.
At minimum, compare:
| Metric | What it tests |
|---|---|
| Revenue growth | Scale and trajectory |
| Operating margin | Core profitability |
| Free cash flow margin | Cash generation |
| Debt to assets | Balance sheet risk |
| Asset turnover | Capital efficiency |
The compare company financials guide covers this workflow in more depth. For stock fundamentals, the peer table is a sanity check: it tells you whether a strength is company-specific or simply normal for the group.
7. Write Down What Would Change Your View
A fundamentals checklist is incomplete without a falsification test. Write down what would make the thesis weaker.
Examples:
- Revenue growth remains positive, but gross margin keeps falling.
- Free cash flow conversion stays weak for two more filings.
- Debt rises faster than operating income.
- Peer margins improve while this company's margins deteriorate.
- The company changes reporting segments in a way that reduces comparability.
This step keeps the analysis honest. It also makes future updates faster because you know what to check when the next 10-Q or 10-K arrives.
Keep the same checklist order when new filings arrive. Updating the same fields in the same sequence makes changes easier to spot: revenue trend first, margin path second, cash conversion third, balance sheet risk fourth, and peer context last. Consistency is what turns a one-time review into a process.
Build the Checklist With API Data
This checklist comes before valuation. Multiples such as P/E, EV/EBITDA, and price-to-free-cash-flow are useful only after the business quality and balance sheet checks are clear.
Here is a compact Python example that pulls the latest annual fundamentals for one ticker and calculates the checklist metrics. It uses the public /api/v2/companies/{ticker}/financials endpoint documented in the app, with X-API-Key stored in an environment variable. Standardized fields, ticker lookup, and period labels are the practical reason the API helps here.
import os
import requests

BASE_URL = "https://fundamentalshub.com/api/v2"
API_KEY = os.environ["FUNDAMENTALS_HUB_API_KEY"]

def get_latest_annual_fundamentals(ticker):
    response = requests.get(
        f"{BASE_URL}/companies/{ticker}/financials",
        params={"period": "annual", "fields": "all", "limit": 1},
        headers={"X-API-Key": API_KEY},
        timeout=20,
    )
    response.raise_for_status()
    payload = response.json()
    if not payload.get("success") or not payload.get("data"):
        raise ValueError(f"No annual financial data returned for {ticker}")
    return payload["company"], payload["data"][0]

def ratio(numerator, denominator):
    if numerator is None or denominator in (None, 0):
        return None
    return numerator / denominator

company, f = get_latest_annual_fundamentals("AAPL")

checklist = {
    "ticker": company["ticker"],
    "period_end": f["period_end"],
    "gross_margin": ratio(f.get("gross_profit"), f.get("revenue")),
    "operating_margin": ratio(f.get("operating_income"), f.get("revenue")),
    "fcf_margin": ratio(f.get("free_cash_flow"), f.get("revenue")),
    "fcf_conversion": ratio(f.get("free_cash_flow"), f.get("net_income")),
    "debt_to_assets": ratio(f.get("total_debt"), f.get("total_assets")),
    "current_ratio": ratio(f.get("current_assets"), f.get("current_liabilities")),
}

print(checklist)
Example Checklist Output: Apple FY2025
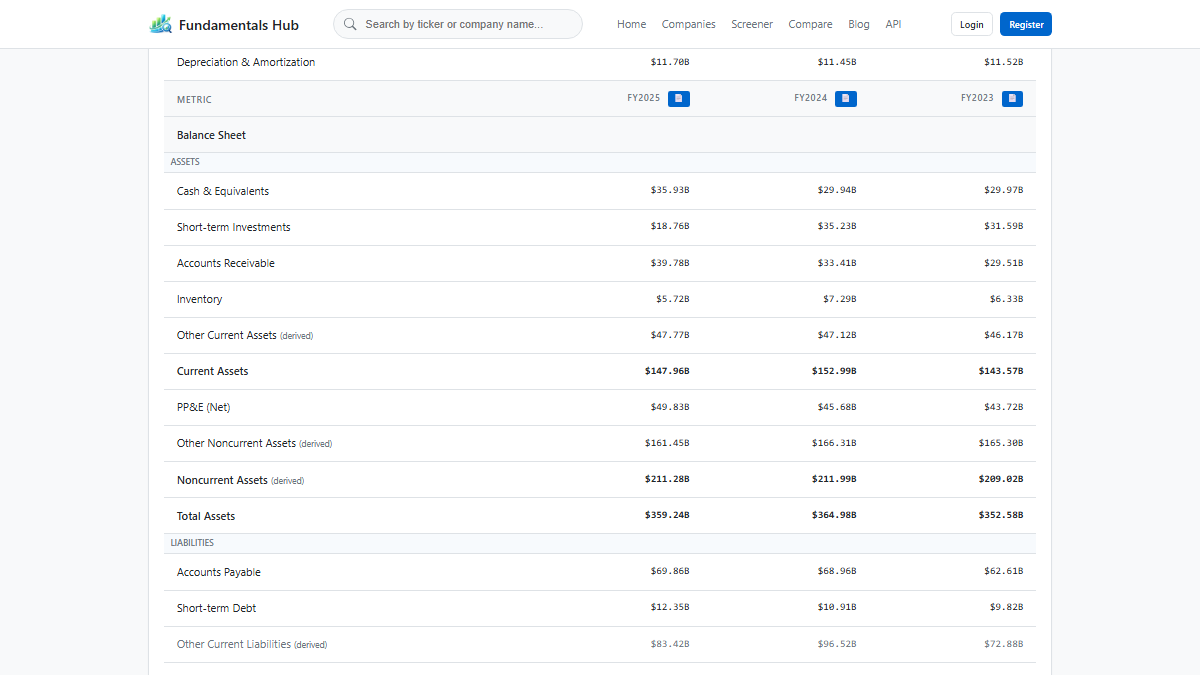
To make the workflow concrete, here is a sample readout using Apple FY2025 from the Fundamentals Hub standardized FY dataset. This is how to analyze stock fundamentals without mixing a TTM screen, an annual table, and a quarterly cash-flow figure in the same conclusion:
| Check | Apple FY2025 signal | What to investigate |
|---|---|---|
| Revenue quality | Revenue rose 6.4% from FY2024 to $416.16B | Segment mix and whether growth is broad or concentrated |
| Margins | Gross margin was 46.9%; operating margin was 32.0% | Prior-year trend and peer margins before ranking quality |
| Cash conversion | Free cash flow conversion was 0.88x | Capex, working capital, and why cash trailed net income |
| Balance sheet risk | Debt to assets was 25.2%; current ratio was 0.89x | Debt maturity, cash cushion, and current liability mix |
| Peer context | MSFT operating margin was 45.6%; GOOG was 32.0% in the latest FY sample | Business model differences before declaring a winner |
The table is deliberately incomplete. A checklist should create the next questions, not pretend to close the analysis. It is business-quality work before valuation, not a stock screen or recommendation. A strong analyst would follow the cash conversion and current-ratio lines into the cash flow statement, balance sheet notes, and management discussion.
The point is not to automate judgement away. The point is to make the first pass repeatable. Once the checklist flags something, read the filing, footnotes, and management discussion to understand the cause.
FAQ
What does it mean to analyze stock fundamentals?
It means evaluating the business through revenue, margins, cash flow, balance sheet strength, growth, and peer context. The goal is to understand business quality and risk before considering valuation.
Which stock fundamentals should I check first?
Start with revenue growth, gross margin, operating margin, free cash flow margin, debt to assets, current ratio, and peer comparison. That set covers growth, profitability, cash generation, and risk.
Is EPS enough for stock analysis?
No. EPS is useful, but it can be affected by share count, taxes, one-time items, and accounting choices. Compare EPS with operating income, net income, and free cash flow.
Should I use annual or TTM fundamentals?
Use TTM for the latest operating snapshot and annual data for durability. Use quarterly data when you are investigating a recent change or a fresh filing.
How do APIs help with stock fundamental analysis?
An API makes the checklist repeatable across companies. If you are deciding how to analyze stock fundamentals across many tickers, the key is standardized fields, clear period labels, and consistent handling of missing values.
How should I use free cash flow conversion when net income is negative?
Do not treat the ratio as a normal score. When net income is negative or close to zero, the denominator can invert or distort the signal. Use free cash flow margin, operating cash flow trend, liquidity, cash runway, and the path back to profitability instead. Label free cash flow conversion as not meaningful when the denominator is too small.