 Fundamentals Hub
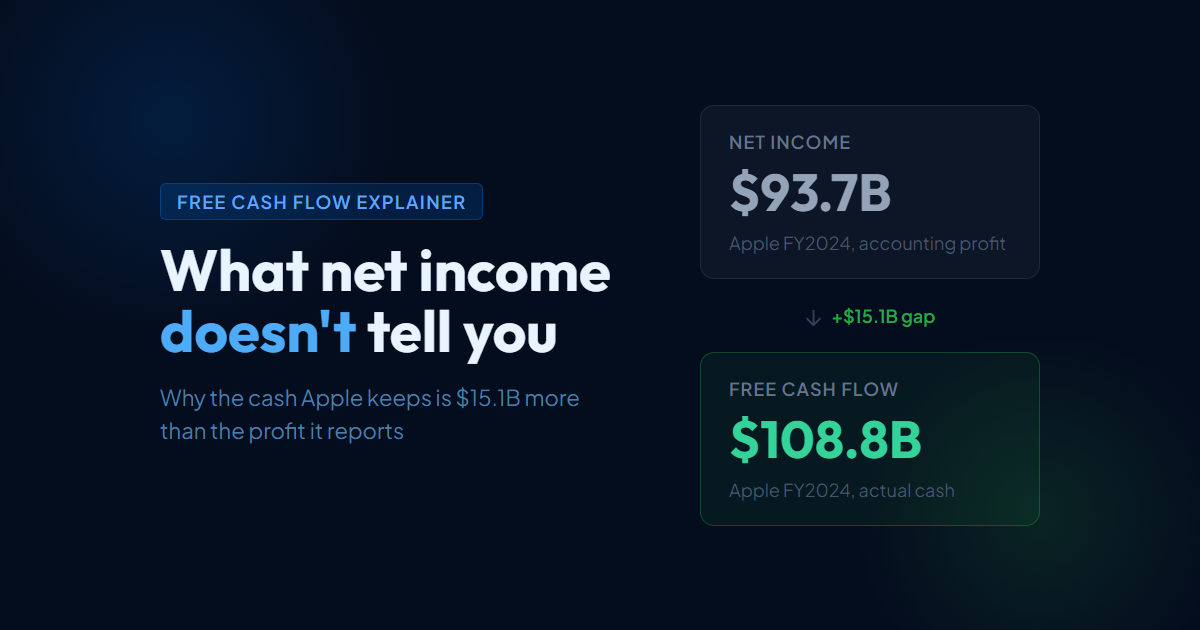
Apple's fiscal year 2024 net income was $93.7 billion. Its free cash flow was $108.8 billion. The cash figure was $15.1 billion higher than the profit figure. For a metric that measures "cash left after running the business," that seems backwards - profit should at least track the cash version of profit.
This gap is the point. Free cash flow measures something fundamentally different from net income, and that difference is diagnostic. This post explains what free cash flow actually captures, why it diverges from net income, how to calculate it, and how analysts use it to value companies.
This is a concept post focused on FCF itself. For the mechanics of reading a complete cash flow statement, the financial statements guide covers all three sections in detail.
Why Net Income and Free Cash Flow Diverge
- Free Cash Flow (FCF)
- Cash from operations minus capital expenditures. Measures actual cash generated after maintaining and growing physical assets.
- Cash from Operations (CFO)
- Cash generated by running the core business. Starts with net income, adds back non-cash charges, and adjusts for working capital changes.
- Capital Expenditures (CapEx)
- Cash spent on physical assets: equipment, buildings, infrastructure. Appears in the investing section of the cash flow statement.
- FCF Yield
- Free cash flow divided by market capitalization. Measures how much cash a company generates per dollar of market value.
Net income follows accrual accounting rules. Revenue is recorded when earned, not when cash arrives. Expenses are recorded when incurred, not when paid. Non-cash charges like depreciation and amortization reduce net income without using any cash. Capital expenditures - buying equipment, buildings, infrastructure - are not expensed on the income statement at all, appearing only on the cash flow statement as a direct cash outflow.
Free cash flow bypasses these accounting conventions and asks a simpler question: how much actual cash did the business produce after paying to maintain and grow its physical assets?
The gap between FCF and net income runs in either direction, and which direction it runs reveals the capital structure of the business:
- FCF > net income: D&A and other non-cash charges may exceed capital expenditures, while working capital and other CFO adjustments may add cash. Either effect, or both, can lift FCF above net income. This pattern is common in software companies, consumer brands with intangible assets, and subscription businesses, but the full CFO bridge determines the cause.
- FCF < net income: Capital expenditures exceed non-cash charges, or working capital is building up faster than revenue. The business is reinvesting more cash than it depreciates. Common in capital-intensive industries - cloud infrastructure, energy, telecom, utilities.
Neither condition is inherently good or bad. They reflect structurally different types of businesses.
The Free Cash Flow Formula
The standard definition that analysts and financial databases use:
Free Cash Flow = Cash from Operations (CFO) - Capital Expenditures (CapEx)Cash from operations (CFO) is the first section of the cash flow statement. It starts with net income and adjusts back to cash by adding non-cash charges (depreciation, amortization, stock-based compensation) and adjusting for working capital changes (increases in receivables reduce CFO; increases in payables increase it).
Capital expenditures appear in the investing section of the cash flow statement, typically labeled "Purchases of property, plant and equipment." A rendered statement commonly displays the purchase as a parenthesized or negative cash outflow. SEC Company Facts and Fundamentals Hub expose the PaymentsToAcquirePropertyPlantAndEquipment value as a positive spending magnitude. With positive CapEx, use FCF = CFO - CapEx; with a signed source value, use FCF = CFO + CapEx. Check the source convention before calculating.
One thing worth knowing before you compare FCF figures across sources: free cash flow is not a reported line item in SEC filings. No company is required to present it, and no standard XBRL tag defines it. Every financial data provider derives it themselves, and the definitions vary. Some subtract only "maintenance capex." Some add back stock-based compensation. The most common variant - CFO minus total CapEx - is what appears on most financial databases and API responses.
Worked Example: Apple vs. Alphabet
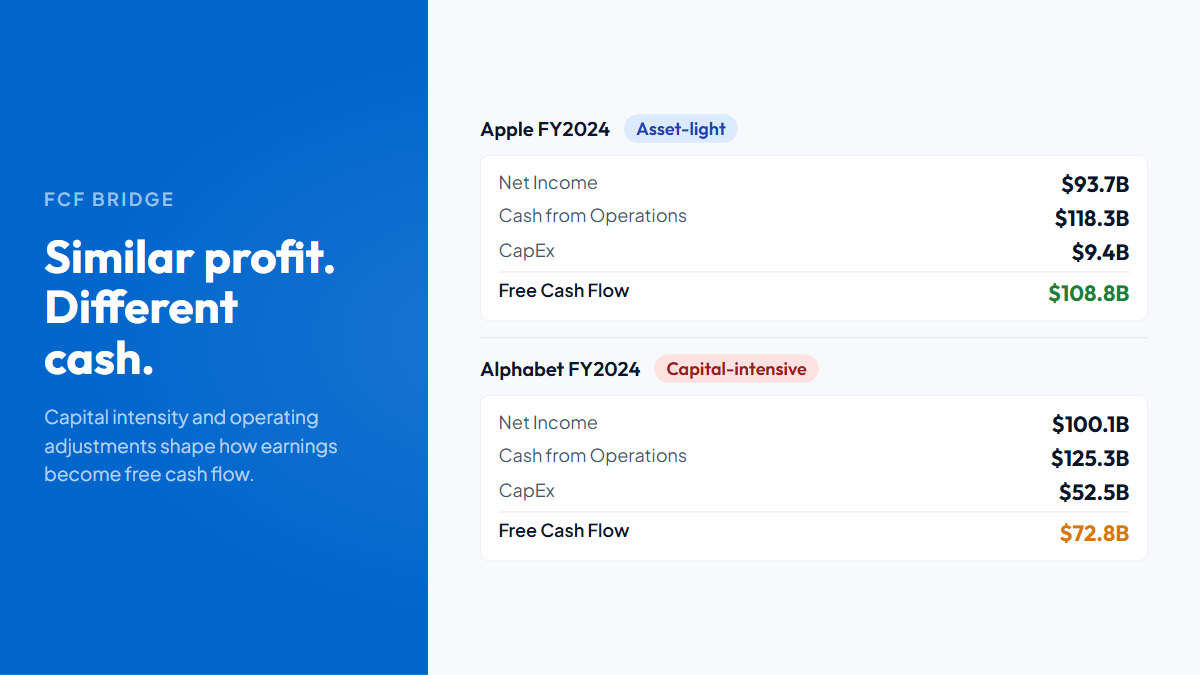
Apple and Alphabet reported similar net income in FY2024, but their free cash flow tells a completely different story about how each business converts profit into spendable cash.
Apple FY2024 shows why an asset-light business generates FCF above net income:
| Line | Amount |
|---|---|
| Net Income | $93.7B |
| + Depreciation & Amortization | +$11.4B |
| + Working Capital & Other | +$13.1B |
| = Cash from Operations | $118.3B |
| - Capital Expenditures | -$9.4B |
| = Free Cash Flow | $108.8B |
Apple's $15.1B gap does not come from D&A alone. D&A of $11.4B less capex of $9.4B contributes about $2.0B, while working capital and other CFO adjustments contribute the remaining $13.1B. Apple's modest physical reinvestment helps, but the full bridge explains why FCF ends up above net income.
Alphabet FY2024 shows the opposite for a capital-intensive business with similar profit:
| Line | Amount |
|---|---|
| Net Income | $100.1B |
| = Cash from Operations | $125.3B |
| - Capital Expenditures | -$52.5B |
| = Free Cash Flow | $72.8B |
Alphabet's CFO is 1.25x net income. But building and expanding the data center infrastructure that powers Google Search, YouTube, and Google Cloud costs $52.5B in capital each year - more than five times Apple's capex. FCF comes in at $72.8B, well below CFO. The business earns significant accounting profit but has to reinvest massively just to keep growing.
The comparison reveals something P/E alone cannot: Apple retains a far higher share of its accounting profit as spendable cash than Alphabet does, even though both companies are enormously profitable. At similar net income levels (~$94B vs ~$100B), Apple converts 116% of profit to FCF while Alphabet converts 73%.
What Free Cash Flow Patterns Signal
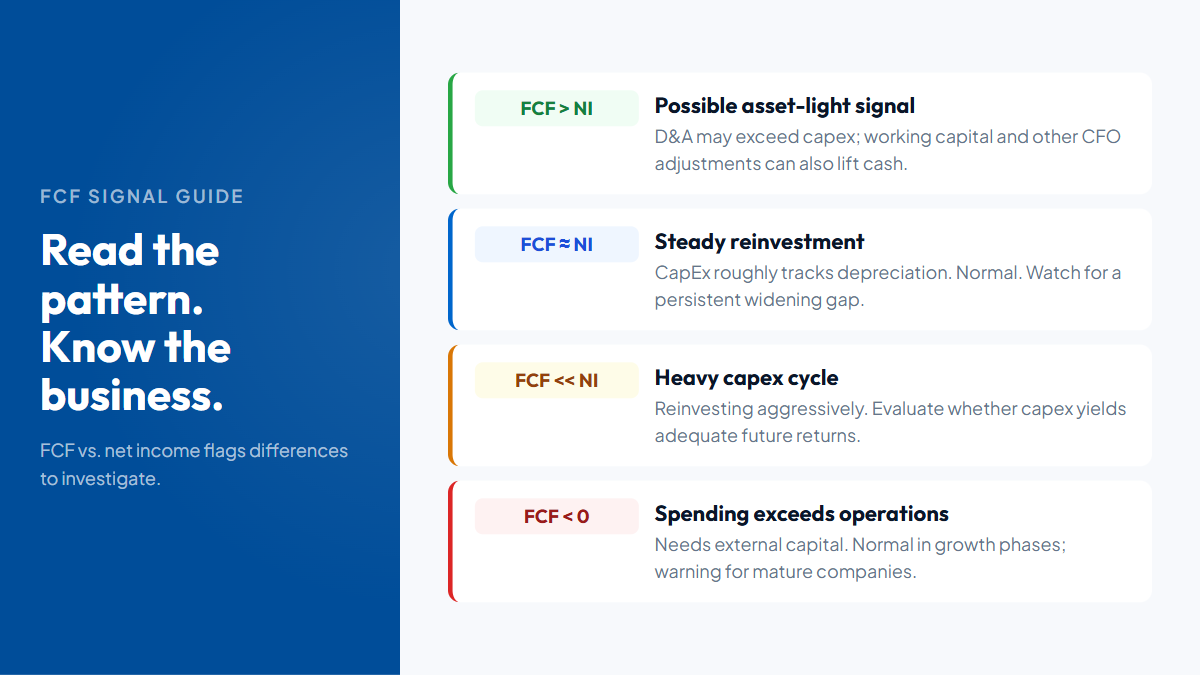
Once you have FCF for a company across several years, four patterns are diagnostic:
FCF consistently above net income means the combined non-cash, working-capital, other CFO, and capex adjustments are positive. D&A exceeding capex is one possible contributor, not the whole explanation. Separate recurring capital efficiency from temporary working-capital releases or other adjustments, and check whether an aging asset base will require catch-up spending.
FCF slightly below net income is normal for the broad middle of the market - businesses where capex roughly tracks depreciation and working capital moves with revenue. Small FCF misses quarter to quarter are noise. A persistent widening gap is a signal.
FCF significantly below net income points to a major capex cycle, heavy growth investment, or working capital strain. A semiconductor company building a new fabrication plant should have FCF well below net income for years. The relevant question is whether the capex yields returns above the cost of capital.
Negative FCF is common at growth-stage companies and during expansion phases. It requires external funding - debt, equity, or existing cash reserves - to bridge the gap. For a young software company scaling infrastructure, negative FCF is expected. For a mature business with flat revenue, it's a warning sign.
Free Cash Flow as a Valuation Metric
Two FCF-based valuation metrics appear regularly in equity analysis:
FCF yield - FCF divided by market capitalization:
FCF Yield = Free Cash Flow / Market CapitalizationApple at its September 2024 market cap of roughly $3.5 trillion and FCF of $108.8B:
FCF Yield = $108.8B / $3,500B = 3.1%A 3.1% FCF yield means Apple generates about 3 cents in cash per dollar of market value. For context, long-term US Treasury bonds yielded around 4% at the same time - so investors were accepting a lower cash yield from Apple in exchange for expected growth in that yield over time.
P/FCF (price-to-free-cash-flow) is the inverse - market cap divided by FCF, analogous to the P/E ratio:
P/FCF = Market Cap / Free Cash Flow = $3,500B / $108.8B = 32xP/FCF is often more useful than P/E for comparing companies with different depreciation schedules or accounting policies, because it removes the noise from non-cash charges. A company that has fully depreciated its assets will show low P/E from reduced D&A but high P/FCF if it still needs to replace those assets. P/FCF catches that.
(Fundamentals Hub provides free cash flow as a pre-computed field - CFO minus CapEx - across FY, Q, and TTM periods for 8,000+ companies, so you don't need to derive it from the cash flow statement yourself.)
Where to Find Free Cash Flow Data
From SEC filings: No single "Free Cash Flow" line exists. Pull two numbers from the cash flow statement: net cash provided by operating activities (CFO) and purchases of property, plant and equipment (CapEx, in the investing section). Subtract the absolute value of CapEx from CFO. That's FCF.
From XBRL: CFO maps to NetCashProvidedByUsedInOperatingActivities. CapEx maps to PaymentsToAcquirePropertyPlantAndEquipment. No tag exists for FCF - it must be derived. When any data provider returns a free_cash_flow field, the underlying computation is always this subtraction.
The SEC EDGAR API guide covers pulling the raw cash flow data directly if you want to compute FCF from XBRL yourself.
Fundamentals Hub computes free cash flow automatically for 8,000+ companies across FY, Q, and TTM periods, standardized from SEC EDGAR data. You can try the free tier here.