 Fundamentals Hub
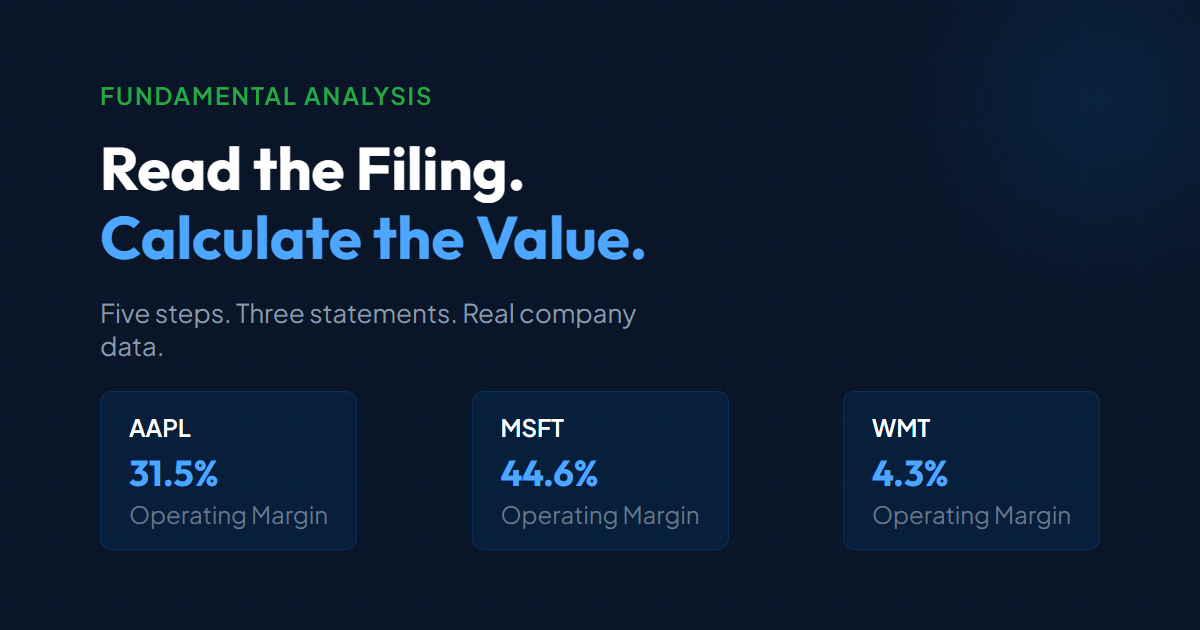
In 2024, Apple reported $391 billion in revenue and $94 billion in net income. By raw size, it looks like the strongest company in the world. But Apple's revenue shrank in fiscal year 2023 before rebounding in 2024. Its liabilities-to-equity ratio remained elevated but moved unevenly over the prior five fiscal years, ranging from 3.96x to 5.96x. Free cash flow, not net income, is what funds the buybacks everyone celebrates.
That is fundamental analysis: looking past the headline numbers to understand what is actually happening inside a business. This guide walks through the process using real data and real calculations, so you can do the same thing yourself with any public company.
What Fundamental Analysis Actually Means
- Fundamental Analysis
- The process of evaluating a company's financial statements, including income statement, balance sheet, and cash flow statement, to assess its intrinsic value and financial health.
- Free Cash Flow (FCF)
- Cash from operations minus capital expenditures. Represents cash available for dividends, buybacks, debt repayment, or reinvestment after maintaining the business.
- Operating Margin
- Operating income divided by revenue. Measures core business profitability before interest and taxes, independent of capital structure.
- Liabilities-to-Equity Ratio
- Total liabilities divided by total equity. Measures financial leverage, indicating how much a company relies on borrowed money versus shareholder capital. Some sources reserve "debt-to-equity" for total debt only divided by equity; this article uses total liabilities for a stricter view.
Fundamental analysis is the process of evaluating a company's financial statements to determine its intrinsic value and financial health. Unlike technical analysis, which studies price charts and trading patterns, fundamental analysis focuses on the business itself: how much money it makes, what it owns, what it owes, and whether those numbers are getting better or worse over time.
The three statements you work with are:
- Income statement – revenue, expenses, and profit over a period
- Balance sheet – assets, liabilities, and equity at a point in time
- Cash flow statement – actual cash moving in and out, broken into operating, investing, and financing
The raw data for all of this comes from SEC filings, specifically 10-K annual reports and 10-Q quarterly reports. Every US public company files these. If you want to understand the mechanics of pulling this data programmatically, the SEC EDGAR API guide covers the endpoints and data structure in detail. For choosing between data providers, the financial data API comparison breaks down pricing and coverage across six options.
This guide focuses on the analysis itself. You can follow along with any company that files with the SEC, using numbers from its most recent annual report.
Step 1: Start with Revenue and Growth
Revenue is the top of every analysis for a reason. It tells you whether the business is growing, shrinking, or treading water. A single year of revenue tells you little. Three to five years of revenue tells you the story.
Here is Apple's annual revenue (USD, billions):
| Fiscal Year | Revenue | YoY Change |
|---|---|---|
| FY 2020 | $274.5 | +5.5% |
| FY 2021 | $365.8 | +33.3% |
| FY 2022 | $394.3 | +7.8% |
| FY 2023 | $383.3 | -2.8% |
| FY 2024 | $391.0 | +2.0% |
How to calculate year-over-year growth:
YoY Growth = ((Current Year - Prior Year) / Prior Year) x 100
FY 2024: (($391.0 - $383.3) / $383.3) x 100 = +2.0%
What the numbers reveal:
- FY 2021 was an outlier (+33.3%), driven by iPhone 12 and pandemic-era demand. Comparing any company to a pandemic-year spike distorts the trend.
- FY 2023 was the first revenue decline in years. A single down year is not alarming on its own, but it flags something to watch.
- FY 2024 recovery was modest (+2.0%). The business is still growing, but the explosive phase has cooled.
Look beyond the percentage. A 2% increase on $383 billion is $7.7 billion in new revenue, more than the total revenue of many Fortune 500 companies. Absolute dollars and percentages tell different stories. Check both.
Red flags in revenue: Declining revenue for two or more consecutive years. Revenue growth that consistently lags the industry. Heavy reliance on a single product or customer for the majority of revenue (check the 10-K's segment reporting section).
Step 2: Check Profitability Down the Income Statement
Revenue tells you the size of the business. Profitability tells you how well it is run. The three margins to track are gross margin, operating margin, and net margin.
Using Apple FY 2024 data:
| Metric | Amount | Margin |
|---|---|---|
| Revenue | $391.0B | - |
| Gross Profit | $180.7B | 46.2% |
| Operating Income | $123.2B | 31.5% |
| Net Income | $93.7B | 24.0% |
The calculations:
Gross Margin = Gross Profit / Revenue x 100
$180.7B / $391.0B x 100 = 46.2%

Operating Margin = Operating Income / Revenue x 100
$123.2B / $391.0B x 100 = 31.5%

Net Margin = Net Income / Revenue x 100
$93.7B / $391.0B x 100 = 24.0%
What each margin tells you:
- Gross margin (46.2%) reflects pricing power and cost of goods sold. Software companies run at 70-80%. Hardware companies run at 25-35%. Apple sits in between because its mix includes high-margin Services revenue alongside iPhones and Macs.
- Operating margin (31.5%) shows what is left after operating expenses (R&D, sales, general admin). This is the cleanest measure of core business profitability. Watch for companies where operating margin is declining even as revenue grows. That signals cost discipline problems.
- Net margin (24.0%) includes everything: interest, taxes, one-time gains or losses. It is the bottom line but can be distorted by non-recurring items. A big gap between operating margin and net margin usually means significant interest expense (debt) or one-time charges.
Track margins over time. A company with stable or improving margins during a revenue slowdown is managing costs well. A company with expanding revenue but shrinking margins is buying growth at the expense of profitability, a pattern that catches up eventually.
Step 3: Read the Balance Sheet for Financial Health
The balance sheet answers a different question than the income statement. Instead of "how much did we earn?", it answers "what do we own, what do we owe, and can we cover our obligations?"
Three ratios cover the essentials:
Current Ratio (Can it pay short-term bills?)
Current Ratio = Current Assets / Current LiabilitiesApple FY 2024: $153.0B / $176.4B = 0.87
Apple's current ratio is below 1.0, meaning current liabilities exceed current assets. For a company with $108 billion in annual free cash flow and $29.9 billion in cash, this is not a concern. For a company burning cash, a current ratio below 1.0 is a warning sign. Context matters.
Liabilities-to-Equity (How much leverage?)
Liabilities-to-Equity = Total Liabilities / Total EquityApple FY 2024: $308.0B / $56.95B = 5.41
Apple carries significant liabilities relative to equity. This is partly intentional: Apple issued cheap debt to fund share buybacks rather than repatriating overseas cash at a higher tax rate. The interest expense is manageable because operating income ($123.2B) dwarfs it. But a leverage ratio above 3.0 for a company with volatile earnings is a structural risk. For comparison, Microsoft sits at 0.91.
Some sources reserve "debt-to-equity" for total debt only (short-term plus long-term debt) divided by equity. This article uses total liabilities for a stricter view of leverage.
Return on Equity (How efficiently does it use equity?)
ROE = Net Income / Total Equity x 100Apple FY 2024: $93.736B / $56.950B x 100 = 164.6%
An ROE above 100% looks extraordinary, and it is. It is also partially a function of Apple's low equity base. The buyback program has reduced equity significantly over the years. Always check ROE alongside leverage. High leverage inflates ROE because the denominator (equity) shrinks as liabilities grow.
Red flags on the balance sheet: Rising debt with flat or declining revenue. Current ratio dropping below 1.0 without a clear explanation. Goodwill exceeding 50% of total assets, which signals heavy acquisition activity that may not generate returns.
Step 4: Follow the Cash
Net income is an accounting construct. Cash flow is reality. A company can report positive net income while burning cash, and investors have been caught by this disconnect more times than anyone wants to admit.
The cash flow statement has three sections:
- Cash from Operations (CFO) – cash generated by the core business
- Cash from Investing (CFI) – cash spent on or received from assets, acquisitions, and investments
- Cash from Financing (CFF) – cash from debt issuance, equity issuance, dividends, and buybacks
Apple FY 2024:
| Cash Flow Component | Amount |
|---|---|
| Cash from Operations | $118.3B |
| Capital Expenditures | $9.4B |
| Free Cash Flow | $108.8B |
| Cash from Financing | -$122.0B |
Free cash flow calculation:
Free Cash Flow = CFO - Capital Expenditures
$118.254B - $9.447B = $108.807B, or $108.8B rounded
Two things to notice here:
First, Apple's free cash flow ($108.8B) exceeds its net income ($93.7B). This happens when non-cash expenses (depreciation, stock-based compensation) are subtracted from revenue to arrive at net income but do not actually consume cash. When FCF consistently exceeds net income, the earnings quality is high.
Second, cash from financing is negative $122.0B. Apple is returning more cash to shareholders (via dividends and buybacks) than it is raising. This is sustainable only because operations generate enormous cash. For a company with negative CFO and negative CFF, the cash runway becomes the critical metric.
A practical check: Compare CFO to net income over several years. If net income is consistently higher than CFO, the company may be recognizing revenue before collecting cash, a pattern that can indicate aggressive accounting.
Step 5: Compare Against Peers
Single-company analysis tells you whether a business is healthy. Comparison tells you whether it is healthy relative to its competitors. The same 30% operating margin means something very different for a software company (below average) versus a retailer (exceptional).
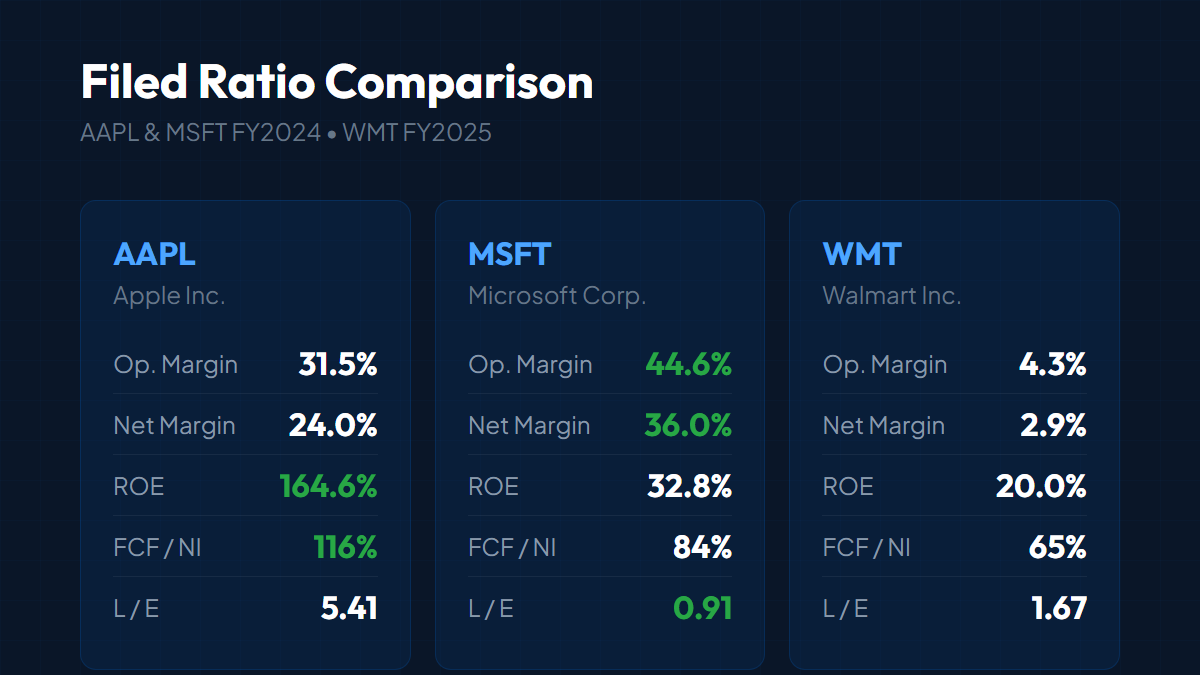
A side-by-side comparison of key metrics for Apple, Microsoft, and Walmart (FY 2024 for Apple and Microsoft; Walmart FY2025, year ended January 31, 2025):
| Metric | Apple | Microsoft | Walmart |
|---|---|---|---|
| Revenue | $391.0B | $245.1B | $681.0B |
| Operating Income | $123.2B | $109.4B | $29.3B |
| Operating Margin | 31.5% | 44.6% | 4.3% |
| Net Income | $93.7B | $88.1B | $19.4B |
| Net Margin | 24.0% | 36.0% | 2.9% |
| Free Cash Flow | $108.8B | $74.1B | $12.7B |
| Liabilities-to-Equity | 5.41 | 0.91 | ~1.7 |
The contrast is stark. Walmart moves vastly more revenue than Apple but converts only 4.3% of it into operating income, because retail is a thin-margin business. Apple captures 31.5% operating margin and Microsoft 44.6% on a fraction of Walmart's top line. The same 30% operating margin would be exceptional for a retailer and disappointing for a software company.
No single company "wins" across every metric. The comparison highlights tradeoffs: Apple trades margin for scale, Microsoft optimizes for margin via software, and Walmart trades margin for scale and inventory turnover. The question is which tradeoffs match your investment criteria.
The challenge when doing this comparison yourself is that raw SEC filings use different XBRL tags for the same concept. Apple calls revenue Revenues, Microsoft uses RevenueFromContractWithCustomerExcludingAssessedTax, and Walmart uses SalesRevenueNet. All three mean the same thing. (Fundamentals Hub normalizes all of this automatically, so you get clean JSON with no XBRL parsing required.)
Putting It All Together
Fundamental analysis is not about finding one magic number. It is about building a picture from multiple angles and looking for consistency or contradictions.
Green flags (signs of a healthy business):
- Revenue growing 3+ years with stable or improving margins
- Free cash flow consistently meeting or exceeding net income
- Manageable debt levels relative to cash generation
- ROE above 15% without excessive leverage
Red flags (reasons to dig deeper or walk away):
- Revenue declining 2+ consecutive years
- Operating margins shrinking while revenue grows
- CFO consistently below net income (earnings quality concern)
- Debt rising faster than cash from operations
One quarter of weak numbers is noise. Two quarters is a pattern. Three quarters is a trend. Fundamental analysis works best when you track the same metrics across multiple periods and compare them against peers, rather than making decisions from a single snapshot.
Where to Get the Data
All the numbers in this guide came from SEC filings, which are public and free. The challenge is getting them in a format that makes comparison easy.
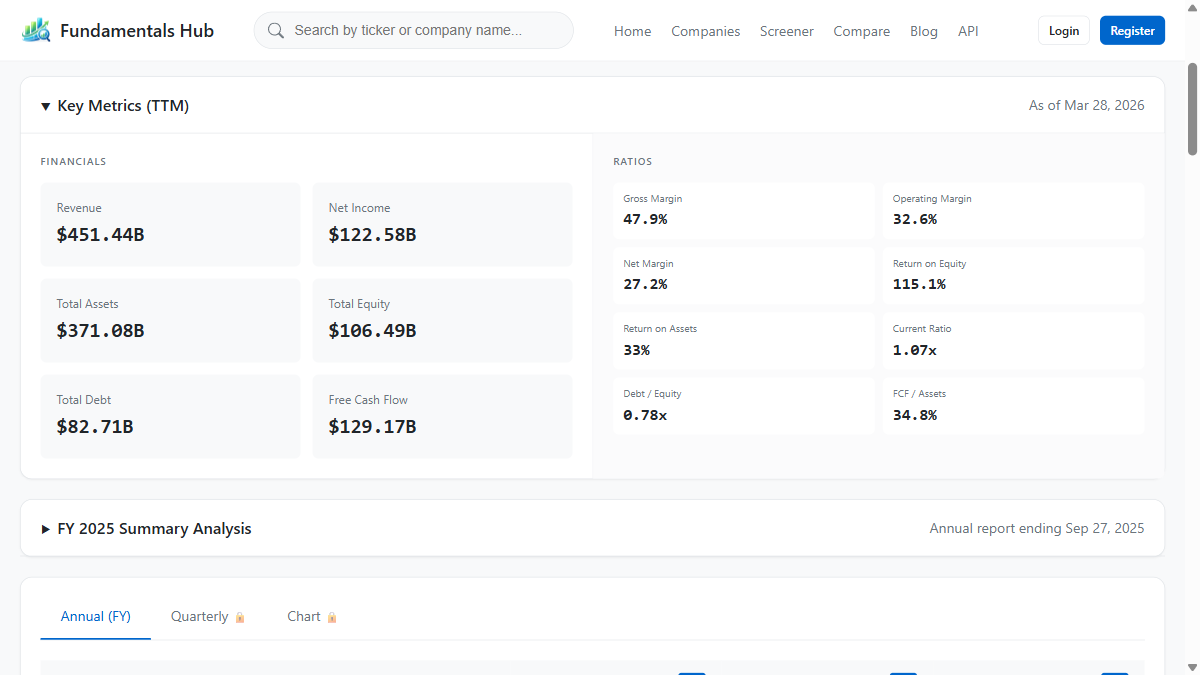
Fundamentals Hub standardizes SEC EDGAR data into a canonical format across all three financial statements and all three period types (annual, quarterly, TTM). The same fields and structure are available for 8,000+ public companies, with a free tier at fundamentalshub.com.