 Fundamentals Hub
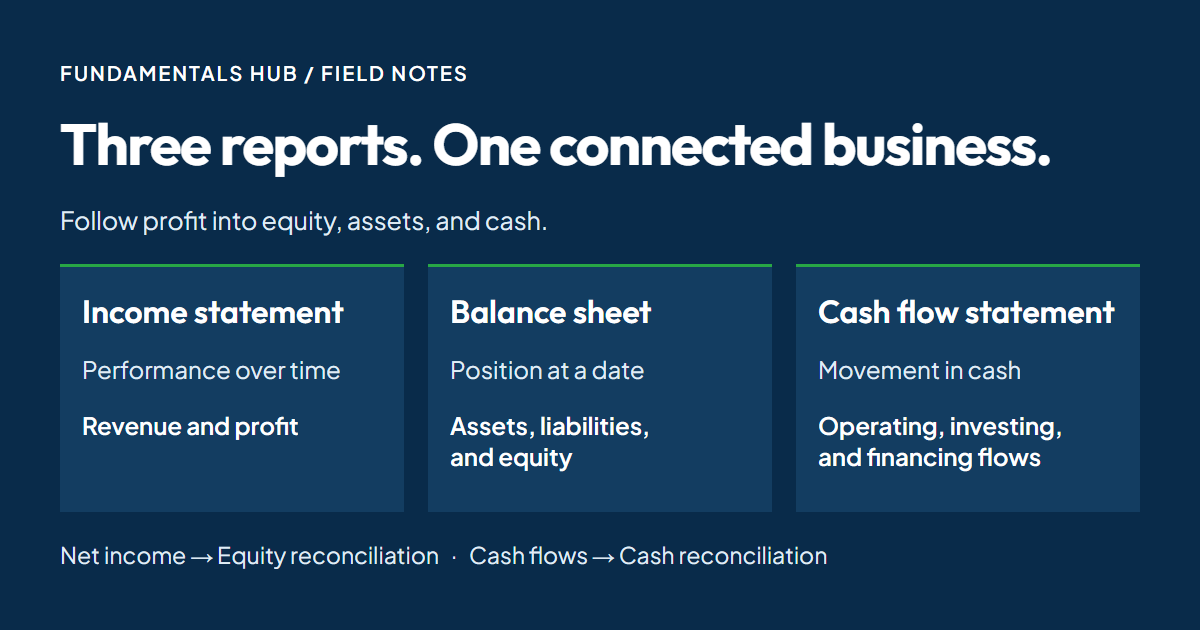
Where does a dollar of profit go after it reaches the bottom of the income statement? It does not automatically land in the bank. It can sit in an unpaid customer invoice, support a larger inventory balance, or contribute to equity while cash leaves through a dividend.
Company financial statements describe those connections from different angles. The income statement measures performance over an interval. The balance sheet records financial position at a date. The cash flow statement explains movement between opening and closing cash balances.
This explainer follows the links between the reports using a small, fully reconciled business example. It focuses on U.S. corporate reporting and on checking whether the numbers fit together. For individual line-item definitions, start with how to read financial statements; for profitability and leverage measures, use the financial statement analysis guide.
Company Financial Statements Measure Different Things
- income statement
- A report of revenue, expenses, and profit over a reporting interval.
- balance sheet
- A report of assets, liabilities, and equity at a specified date.
- cash flow statement
- A reconciliation of opening and closing cash through operating, investing, financing, and applicable exchange-rate effects.
An annual income statement and an annual cash flow statement describe activity across a fiscal year. A balance sheet dated at that year-end describes the resulting position. Putting all three under a column labeled “2025” hides a distinction that matters whenever you reconcile them.
The three-report shorthand also leaves something out. A complete reading includes the statement of shareholders' equity and the notes. The equity statement explains changes in ownership capital; the notes supply accounting policies and details that summary totals cannot convey. The SEC's financial statement guide identifies four main statements, including shareholders' equity.
| Report | Time basis | Connection to follow |
|---|---|---|
| Income statement | Activity over an interval | Net income feeds the equity reconciliation |
| Balance sheet | Position at one date | Cash ties to the cash flow closing balance, after matching definitions |
| Cash flow statement | Activity over an interval | Operating, investing, and financing flows explain the cash change |
| Shareholders' equity | Movement across an interval | Profit, distributions, and other equity changes explain closing equity |
Read the date headings before the amounts. “Year ended” and “as of” are different instructions. Also check the units: a table in millions and an API value in dollars can describe the same fact with numbers that differ by a factor of one million.
Follow Revenue From Profit to Cash
Consider a hypothetical service business for one year. All figures below are in thousands of dollars. It opens with $100 of cash, no liabilities, and $100 of shareholder equity. There are no opening receivables, fixed assets, or other balances.
During the year it earns $200 of revenue, collects $160 from customers, and pays $120 of operating expenses. It also buys equipment for $30 in cash and records $10 of depreciation. Assume no taxes, interest, inventory, unpaid expenses, or other transactions except the dividend introduced below.
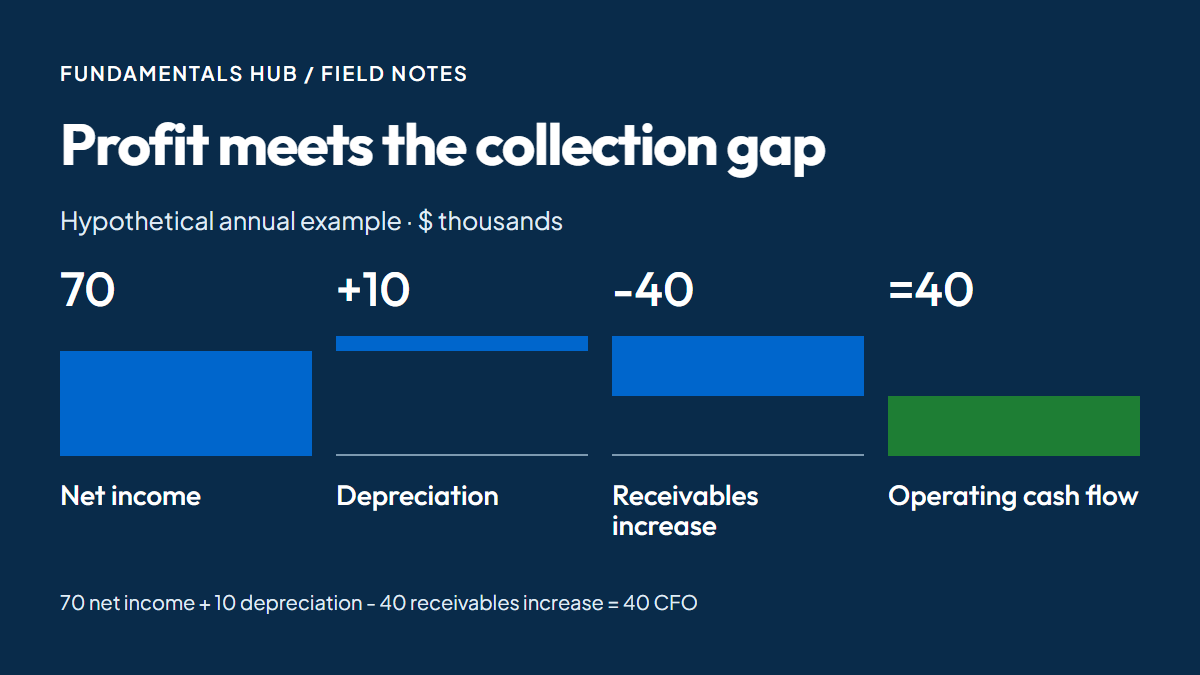
The income statement reports $70 of net income: $200 revenue minus $120 operating expenses minus $10 depreciation. The uncollected $40 is still revenue under the example's assumption that the service has been delivered and revenue recognition criteria are met. It appears as accounts receivable on the closing balance sheet.
Cash from operating activities is $40: $160 received less $120 paid. Under the indirect presentation, the same result starts with $70 of net income, adds back $10 of noncash depreciation, and deducts the $40 increase in receivables. That subtraction removes revenue included in profit but not collected during the year.
This is why rising profit does not identify the source of a cash increase. When a customer pays an invoice already recognized as revenue, cash rises and receivables fall; the collection does not create a second sale. Following the transaction prevents counting the same economic activity twice.
Close the Balance Sheet and Equity Loop
Now add a $20 cash dividend, declared and paid within the year. Investing cash flow is negative $30 for the equipment purchase. Financing cash flow is negative $20 for the dividend. There is no borrowing, share issuance, foreign exchange effect, or restricted cash in this example.
Closing cash is therefore $90: $100 opening cash plus $40 operating cash flow minus $30 investing outflow minus $20 financing outflow. Equipment closes at a net carrying amount of $20, reflecting its $30 cost less $10 depreciation. Receivables remain $40.
| Closing balance sheet, hypothetical $000 | Amount |
|---|---|
| Cash | 90 |
| Accounts receivable | 40 |
| Equipment, net | 20 |
| Total assets | 150 |
| Total liabilities | 0 |
| Shareholders' equity | 150 |
Equity independently reconciles to $150: opening equity of $100 plus net income of $70 less the $20 dividend. Assets equal liabilities plus equity: $150 = $0 + $150. Profit was positive, equity increased, and cash declined, with no contradiction between the reports.
A dividend is a distribution to owners, not an operating expense in this example. Real equity statements contain further movements, such as share issuance, repurchases, stock compensation, and other comprehensive income. Do not expect opening equity plus net income minus dividends to explain every company's closing balance without those additional lines.
(Fundamentals Hub provides standardized income statement, balance sheet, and cash flow fields together, making it easier to compare the reported totals before tracing differences into the filing.)
Check the Cash Definition Before Reconciling
The general reconciliation is opening cash plus operating cash flow (CFO), investing cash flow (CFI), financing cash flow (CFF), and any foreign exchange effect equals closing cash. Use signed flows: an outflow reduces the balance. Both endpoints must use the same definition of cash as the statement being reconciled.
Apple provides a concrete historical check. For the fiscal year ended September 28, 2024, its cash flow statement reports the following amounts in millions of dollars. These are FY2024 figures, not a current operating snapshot. Source: Apple's FY2024 consolidated financial statements, page 3.
| Apple FY2024 cash reconciliation, $ millions | Amount |
|---|---|
| Opening cash, cash equivalents, and restricted cash | 30,737 |
| Operating cash flow | +118,254 |
| Investing cash flow | +2,935 |
| Financing cash flow | -121,983 |
| Closing cash, cash equivalents, and restricted cash | 29,943 |
The arithmetic is 30,737 + 118,254 + 2,935 - 121,983 = 29,943. Apple's balance sheet cash and equivalents at the prior year-end was 29,965, which is narrower than the cash flow opening total of 30,737. Substituting it would create a false reconciliation failure. The cash flow statement does not show a separate FX line for this year.
For any company, inspect the reported cash reconciliation and associated notes when the scope differs. Adding short-term investments to one endpoint, or excluding restricted cash from only one side, breaks the comparison even if every extracted amount is accurate.
Free cash flow answers a separate question. It subtracts capital expenditure from operating cash flow under a stated definition; it does not explain the entire movement in cash after financing and other investing activity. The free cash flow explainer covers that calculation in detail.
Match the Interval, Not Just the End Date
Company financial statements can share an end date while covering different lengths of time. A June income statement might show both three-month and six-month results. The accompanying interim cash flow statement can show six-month cumulative activity. Calling both columns “Q2” does not make them comparable.
For a filed example, Quanta Services' June 2026 Form 10-Q presents three- and six-month income results alongside six-month cash flows. A developer selecting XBRL facts by end date alone can combine quarterly profit with year-to-date CFO without noticing the mismatch.
For hypothetical cumulative CFO of $18,000 in the first quarter and $45,000 through the second quarter, standalone second-quarter CFO is $27,000: $45,000 minus $18,000. Both cumulative inputs must refer to the same fiscal year, reporting scope, and compatible accounting basis. If a later filing revised the first-quarter comparative, use consistent revised values.
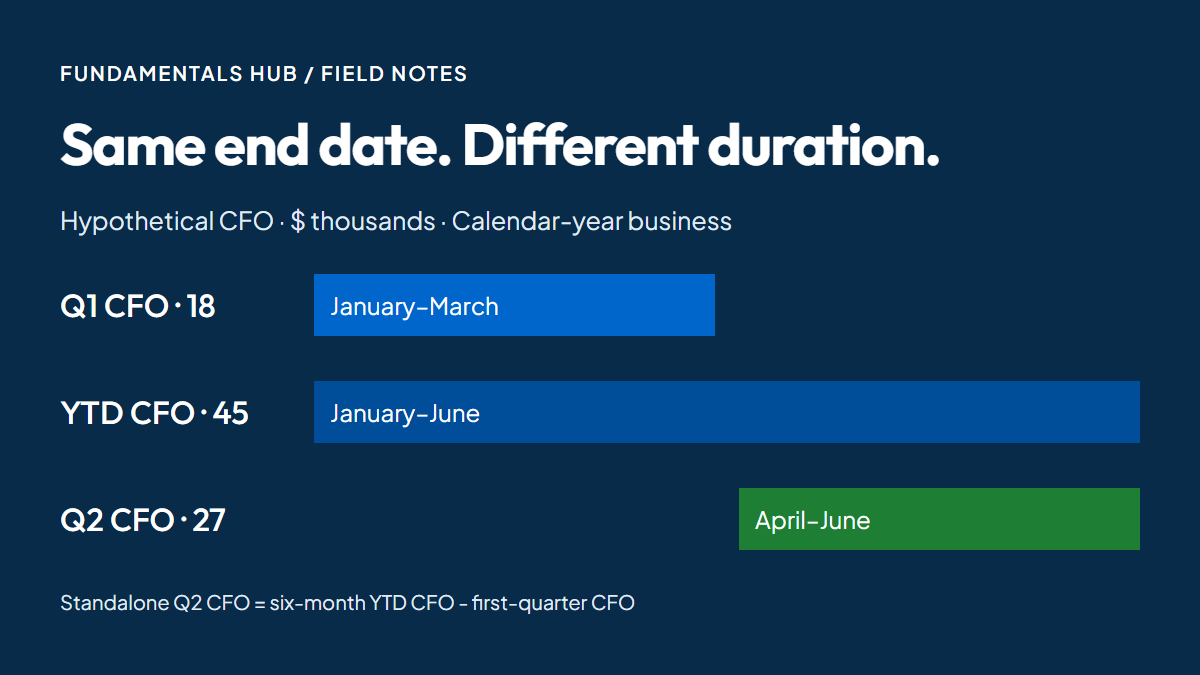
The opening cash balance for a year-to-date cash flow reconciliation is the prior fiscal year-end balance. For a standalone quarter, use the preceding quarter-end instead. Balance sheet amounts remain snapshots; never add four quarterly cash balances to construct trailing-twelve-month cash.
When assembling company financial statements from SEC data, retain the fact's start date, end date, unit, and filing reference where available. A label such as Q2 is useful for display, but it cannot replace the duration. The XBRL data guide explains the broader extraction issues; interval matching is the specific check needed here.
Use Reconciliations to Find the Next Question
Start with two checks: assets equal liabilities plus equity, and opening cash plus signed cash flows and FX equals closing cash. When the filing includes a combined liabilities-and-equity total, compare assets against that reported total as well. Keep the same consolidation scope on both sides, including noncontrolling interests where applicable.
If a check fails, inspect units, dates, cash definitions, and missing fields before interpreting it as a business problem. A missing liability value is unavailable information, not evidence that the company owes nothing. Small differences can also arise because displayed figures are rounded.
Passing those checks establishes arithmetic consistency, not completeness or business quality. The hypothetical business above reconciles perfectly while its customers still owe $40. The useful follow-up is to examine collection terms and receivable aging; a balanced spreadsheet cannot answer whether those invoices will be paid.
Use summary company financial statements to locate the connection that needs investigation, then read the relevant note. That keeps the analysis anchored to the transaction: what created profit, which asset or liability changed, and when cash actually moved.
FAQ
Noncash purchases need separate attention: equipment acquired by issuing shares changes assets and equity without creating an investing cash payment. The cash flow reconciliation alone will not describe that transaction.
The examples here assume cash purchases and distributions. When a filing discloses noncash investing or financing activity, read that disclosure alongside the statement before applying the simplified equations in this article.
Why can equity increase while cash falls?
Profit can increase retained earnings while revenue remains uncollected. Equipment purchases and dividends can also consume cash. In the hypothetical example, $70 of profit and a $20 dividend increase equity by $50 while cash falls by $10.
Does collecting an invoice create revenue again?
No, if that revenue was already recognized. Collection replaces a receivable with cash. Recording another sale would overstate both revenue and profit.
Why does opening cash differ between two statements?
Check their definitions and dates. A cash flow reconciliation may include restricted cash that is outside the balance sheet's cash-and-equivalents line. A year-to-date statement also starts at fiscal year-end, rather than the preceding quarter-end.
Can I subtract Q1 CFO from Q2 CFO?
Only when the Q2 amount is cumulative through six months and Q1 covers the first three months on a compatible basis. If Q2 is already a standalone quarter, subtracting Q1 again produces the wrong result.
Does a balanced balance sheet prove the data is correct?
No. An omitted asset and an equally understated liability can preserve equality. Reconciliation is one check; source agreement, completeness, and consistent reporting scope still matter.